Here’s something most ecommerce founders won’t admit — they check their revenue every morning and call it data analysis. Revenue tells you what happened. It tells you nothing about why, or what comes next. If you’re running an ecommerce brand and making decisions based on top-line numbers alone, you’re not really driving the business. You’re watching it from the backseat.

Knowing track ecommerce KPI effectively for business growth is the shift that changes that. Not because KPIs are some magical solution, but because when you actually know your numbers — the real ones, not just the flattering ones — you make better calls, catch problems earlier, and stop spending money on things that aren’t working.
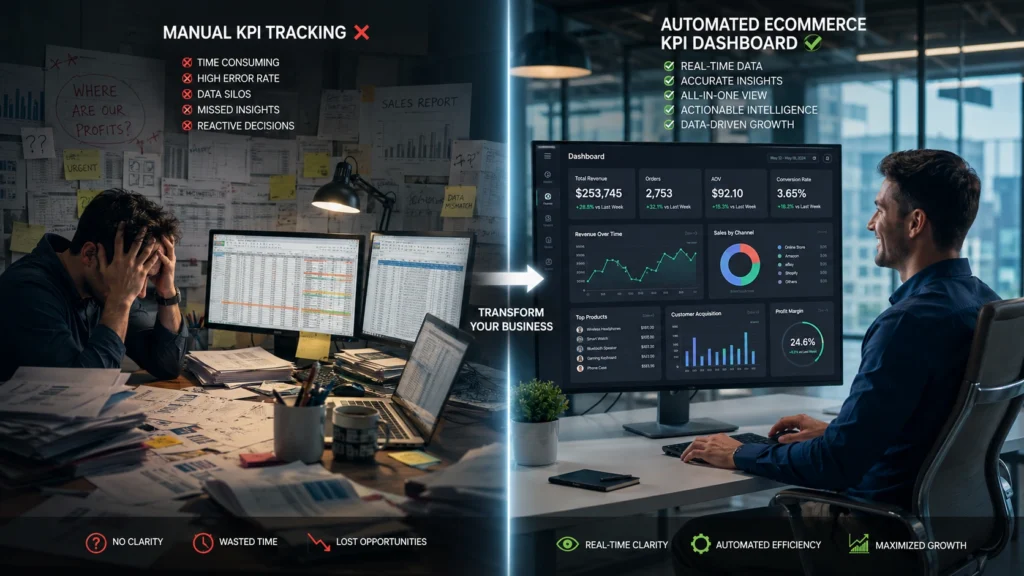
Most Brands Have Data. Very Few Have Clarity.
There’s no shortage of data in ecommerce. Shopify gives you reports. Meta gives you reports. Your logistics partner gives you reports. Google Analytics gives you reports. And yet, somehow, most founders still can’t answer basic questions like — which acquisition channel is actually profitable after returns? Which SKU is eating into margins? Which geography is dragging down the delivery SLA?
That’s the real problem. It’s not a lack of data — it’s that the data lives in too many places and nobody has made it mean something.
Ecommerce performance metrics tracking isn’t about collecting more numbers. It’s about deciding which numbers matter, putting them in one place, and looking at them consistently enough to actually act on what they’re telling you. That discipline alone puts you ahead of most brands your size.
The KPIs That Actually Move the Needle
Not every metric deserves your weekly attention. These are the ones that do — and why:
- Conversion Rate (CVR) — The most sensitive number in your business. A small drop here has massive revenue implications at scale. If it slips and you’re not watching, you’ll blame the ads before you realise the product page broke on mobile.
- Customer Acquisition Cost (CAC) — Not just what you spend per click, but what you actually spend to get one paying customer across all channels. When this starts climbing and nobody notices, it quietly kills your margins.
- Average Order Value (AOV) — Simple to track, often ignored. Bundles, upsells, free shipping thresholds — these moves only make sense when you know your AOV baseline and are watching how it shifts.
- Customer Lifetime Value (CLV) — The number that tells you whether your business model actually works long term. If CAC is high but CLV is higher, you’re fine. If they’re too close, you have a retention problem disguised as a growth story.
- RTO Rate — India-specific and brutal. Every undelivered COD order is a double loss — you paid to acquire the customer and paid to ship the order. If this isn’t in your weekly review, it should be.
- Cart Abandonment Rate — A high abandonment rate is rarely a pricing problem. It’s usually trust, friction, or a broken checkout flow. You won’t know which until you’re tracking it.
- Net Promoter Score (NPS) — The only metric that tells you what customers actually think. Most brands measure it once a year during a review. The brands that use it well measure it continuously.
Your backend operations directly shape several of these numbers — particularly RTO, CVR, and CLV. The fulfilment experience a customer has affects whether they come back, and whether that order even completes. Understanding the impact of backend systems on ecommerce fulfilment performance shows you exactly how operations and KPI performance are connected.
Why Tracking These KPIs in Isolation Is a Waste of Time
Here’s something the standard KPI guides don’t tell you — track ecommerce KPI effectively for business growth is not about looking at numbers in isolation. Looking at any one of these metrics on its own is often misleading. CAC going up could mean your ads are getting expensive — or it could mean your landing page conversion dropped. RTO going up could mean a logistics problem — or a product description problem that’s creating unmet expectations at delivery.
Ecommerce business performance measurement works when you look at metrics in relation to each other. CAC against CLV. CVR against traffic source. RTO against SKU and pincode.
The brands that genuinely understand their business are the ones asking second-level questions. Not just “what is the number?” but “why did it move, and what does it mean for the number next to it?” That’s where ecommerce analytics for business growth stops being a reporting exercise and starts being a genuine competitive advantage.
Building a Tracking System You’ll Actually Use
The honest reason most ecommerce brands have bad KPI visibility isn’t because they lack tools. It’s because the tracking systems they build are too complicated to maintain and too fragmented to trust. A dashboard nobody checks is worse than no dashboard at all — it creates false confidence. This is exactly why it’s important to track ecommerce KPI effectively for business growth instead of just collecting data without a clear system or review process.
Here’s what actually works:
Step 1 — Pick 8 to 12 KPIs maximum.
Not 40. Not every metric your platform can generate. The ones that, if they moved significantly, would change a decision you’re making.
Step 2 — Establish a baseline before you set targets.
You can’t know if your RTO rate improved if you never recorded what it was. Spend two weeks just recording before you start optimising.
Step 3 — Connect your data sources.
Your store, your ad platforms, your 3PL or logistics partners, and your CRM need to talk to each other. Ecommerce data tracking and reporting only works when data isn’t being manually transferred between systems by someone with a spreadsheet.
Step 4 — Automate the reporting layer.
Weekly reports should generate themselves. If someone on your team is spending hours pulling data together, that time is being wasted and the report is probably already outdated by the time it’s read.
Step 5 — Create a review rhythm.
Operations KPIs — weekly. Growth KPIs — monthly. Strategic KPIs — quarterly. Without this rhythm, even a perfect dashboard collects dust.
The quality of your backend workflow determines the quality of your KPI data. Broken processes create dirty data, and dirty data leads to bad decisions that feel data-driven. Getting the underlying infrastructure right is what makes the tracking layer trustworthy — and that starts with understanding how ecommerce backend workflow systems actually function.
Read More: Ecommerce Backend Workflow Systems
The Tools — Without the Overcomplication
There are dozens of ecommerce reporting dashboard tools available. Most brands don’t need the expensive ones. Here’s a practical view:
- Google Looker Studio — Free, powerful, and connects to almost everything. Most growing brands can get 80% of the visibility they need here without spending a rupee.
- Shopify Analytics — Good for store-level data. Not sufficient on its own, but a solid data source feeding into a broader dashboard.
- Glew.io — Built specifically for ecommerce. Good for CLV tracking and cohort analysis when you’re ready to go deeper.
- Supermetrics — Useful when you need to pull ad platform data alongside ecommerce data without manual exports.
- Triple Whale — Growing fast among D2C brands, especially for attribution. Worth considering once you’re running significant paid media.
The tool matters less than the habit. According to a McKinsey report on data-driven organisations, companies that use customer analytics consistently are 23 times more likely to outperform competitors in acquisition and 6 times more likely to outperform in retention. The advantage isn’t in having the fanciest ecommerce reporting dashboard tools — it’s in the discipline of actually using them.
What Good KPI Tracking Actually Prevents
Most people talk about KPI tracking as a growth tool. It’s equally — maybe more so — a protection tool, which is exactly why you need to track ecommerce KPI effectively for business growth rather than treating it as a reporting exercise.
High RTO is the most obvious example. Brands that catch a rising RTO rate at 14% can fix it before it hits 22%. Brands without ecommerce KPI tracking systems India-wide don’t know there’s a problem until the courier invoice arrives and the margin calculation comes out wrong. By then, the damage is done across hundreds or thousands of orders.
Same with CAC. A rising CAC is a slow leak — barely noticeable week to week, significant over a quarter. If you’re only looking at monthly revenue and not weekly acquisition efficiency, you’ll miss the trend until you’re wondering why profitability is shrinking despite growing sales.
Ecommerce performance metrics tracking is how you catch these things early. And early is the only time it’s cheap to fix them.
Read More: Causes of High RTO in Ecommerce and How to Reduce It
From Tracking to Deciding — The Part Most Guides Skip
Tracking KPIs and acting on KPIs are two different disciplines. Plenty of brands have dashboards. Far fewer have a culture of making decisions from them.
Every KPI review should end with the same question: what are we changing because of this? Not in theory. In practice. This week. If CAC is up, which campaign is getting paused or restructured? If NPS dropped, which part of the post-purchase experience is being reviewed? If AOV fell, which bundle or upsell mechanic is being tested?
Ecommerce data tracking and reporting without this decision loop is just expensive journalism — you’re documenting what happened without changing what happens next. The brands that truly understand track ecommerce KPI effectively for business growth are the ones where every number has an owner, every review has an agenda, and every metric movement triggers a response.
Tying your KPI discipline into a broader growth strategy is what makes it all compound. Understanding top 10 business growth strategies for 2025 gives that broader context — because KPI tracking without strategic direction is optimisation without destination.
Conclusion
Ecommerce analytics for business growth isn’t a tool or a platform — it’s a habit. Building ecommerce KPI tracking systems India brands can actually rely on means choosing the right metrics, connecting the right systems, reviewing with the right frequency, and — most importantly — making decisions from what you find.
The brands that win aren’t the ones with the most data. They’re the ones that have decided which data matters, built the discipline to look at it consistently, and developed the courage to change course when the numbers say to. That’s what knowing track ecommerce KPI effectively for business growth actually means in practice. Start there, and everything else gets easier.
Frequently Asked Questions (FAQs) How to Track Ecommerce KPI Effectively for Business Growth
1. What are the most important KPIs for an ecommerce business?
The ones that directly connect to profitability and retention — CVR, CAC, AOV, CLV, RTO rate, cart abandonment, and NPS. Early-stage brands should focus on CVR and CAC first. Scaling brands need to add CLV and RTO into their weekly visibility.
2. How often should ecommerce KPIs be reviewed?
Operations KPIs like RTO and fulfilment rate need weekly attention — problems here compound fast. Growth metrics like CAC and CLV work on a monthly review cycle. Strategic metrics like CLV trends and channel mix are quarterly conversations.
3. What tools are best for ecommerce KPI tracking in India?
Google Looker Studio connected to Shopify and Google Analytics covers most of what growing Indian brands need without significant cost. As you scale, Glew.io and Triple Whale add depth on CLV and attribution. The tool matters less than the consistency of use.
4. Why do so many ecommerce brands fail at KPI tracking?
Usually because they try to track too many things, build dashboards nobody maintains, or review numbers without a decision framework attached. Ecommerce business performance measurement only works when it’s simple enough to sustain and structured enough to drive action.
5. How does KPI tracking connect to reducing RTO?
Consistent ecommerce data tracking and reporting surfaces RTO trends by geography, SKU, and courier before they become expensive patterns. Brands that catch a rising RTO rate early can intervene — adjusting COD eligibility, improving product descriptions, or flagging problem pincodes — before the margin damage accumulates.